
.avif)
If you own digital accessibility at your institution, you already know the tooling. You can open a file and get a verdict on that file. What you can't get is the answer your provost would actually ask: how accessible is this institution, and is it getting better or worse?
That gap is why accessibility work stays invisible. Leadership has never had a number they could read.
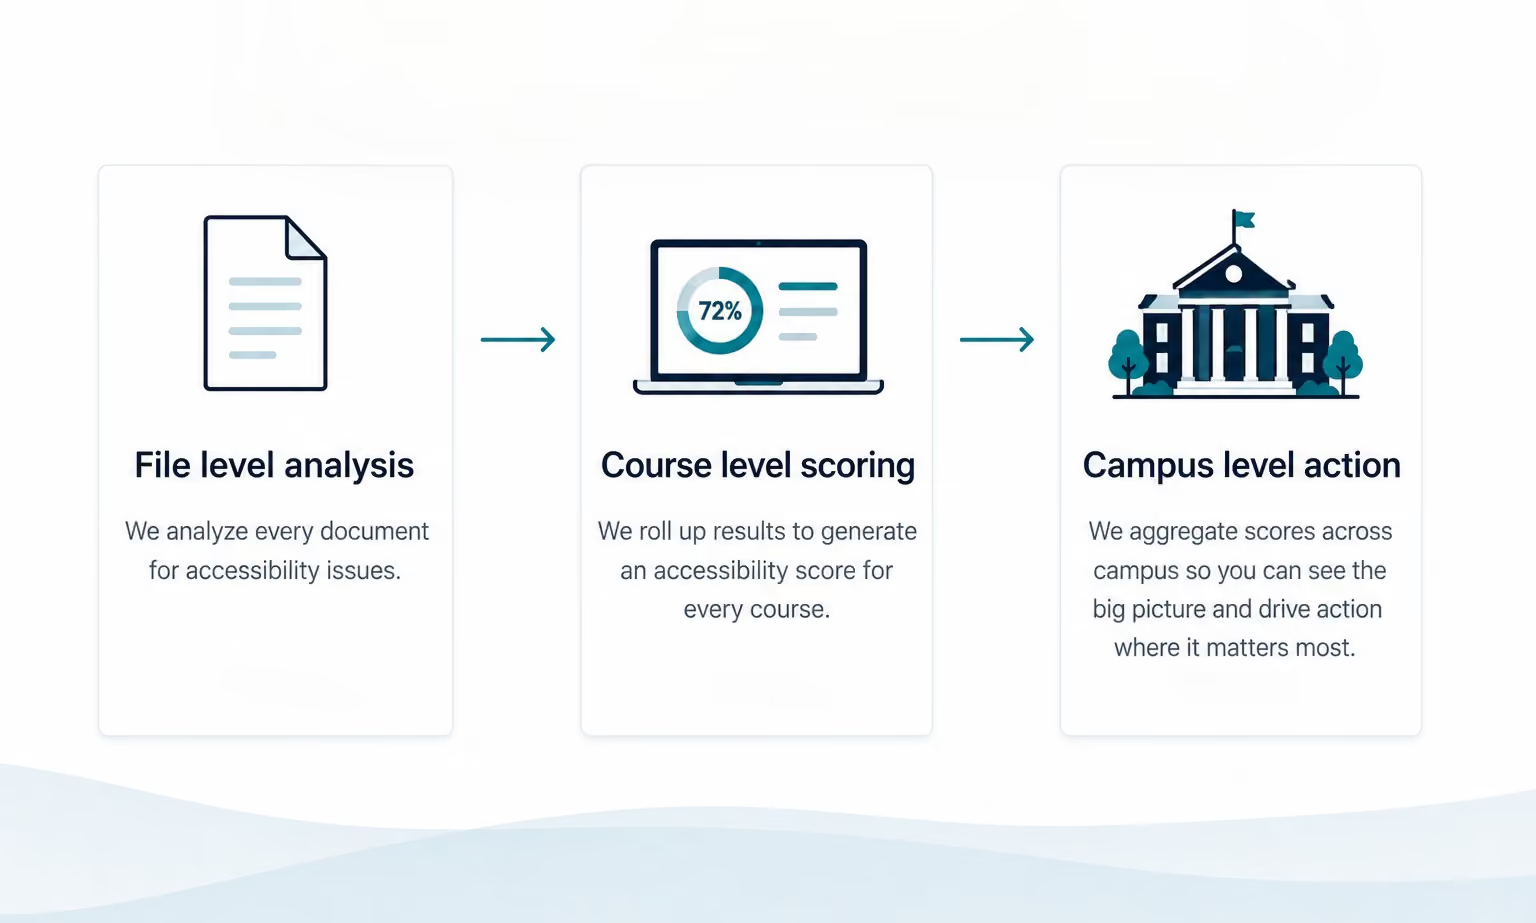
The tooling was built to answer one question well: does this file meet WCAG 2.1 AA? Run that assessment across a single document and you get a clean result. Run it across the forty thousand documents in a mid-size LMS and you get forty thousand results and still no answer. Digital accessibility work has never had a shortage of assessment. It has had a shortage of aggregation. Every file gets checked, and nothing adds up to a number a dean can hold.
Here is the sharpest way one accessibility director put it to her faculty: a course sitting at 50% doesn't mean the course is half compliant. It means that for some of your students, only half the material is actually there. The other half may as well not exist. Once faculty hear the score that way, it becomes a description of how much of their teaching is actually reaching students.
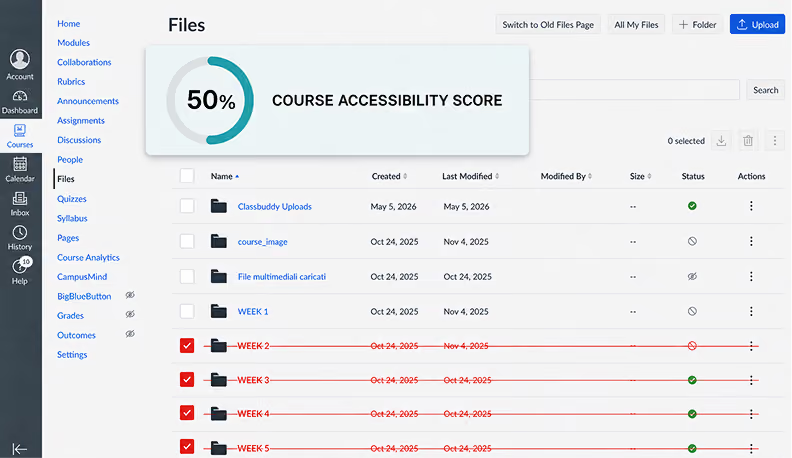
That's why the score matters. It moves the unit of measurement from the file to the institution, and it puts teaching at the center. The CampusMind Score does exactly that: one number for the institution, built from every course and every document, refreshed as content changes.
It helps to be clear about what an accessibility score is and isn't. Underneath it, the WCAG accessibility criteria are still doing the work: contrast ratios, alt text, heading structure, reading order. A file either meets each criterion or it doesn't. Those checks are binary, technical, and per-file, which is exactly why they never traveled past the accessibility office. The score doesn't replace WCAG conformance. It rolls those pass-and-fail results up into a percentage a course can carry, then a college, then a campus. WCAG stays the ground truth. The accessibility score is the layer above it that everyone else can read.
Most accessibility conversations start by trying to teach faculty the rules. Contrast ratios, alt text, heading structure, WCAG levels. None of it is what they were trained to teach. The assumption underneath is that this is a knowledge gap: if faculty understood the standards, they'd meet them. So they sit through the workshop, they nod, and nothing changes. Knowing what alt text is has never once made a professor go back and write it. The rules were never what was stopping them.
What moves them is seeing the state of their own course. Show a faculty member a course sitting at 72 and you don't have to explain what it means. 72 is a C. In a room of educators, a grade never needs translation. Once a course has a grade, faculty behave the way they behave with any grade: they want it higher.
Then show them where that 72 sits against the rest of the department, and the buy-in stops being about accessibility at all. A professor who skips every compliance training will still notice that their course is the lowest in the department. The score hands them a reason that was already theirs.
And the grade tells them where to spend the one hour they have. A 72 isn't a lecture about compliance; it's a short list of the three files dragging the course down. The score doesn't just motivate the work. It points at it.
For any of this to hold, the number has to stay safe to look at. A low score triggers a conversation and help from the accessibility team, never a write-up. The moment faculty suspect the grade will be used against them, they stop trusting it and it stops working. Kept low-stakes, it's the version of visibility faculty will actually cooperate with, and that cooperation is what carries the number past them to the rest of the campus.
Once faculty are reading their scores, department chairs start asking to see the department roll-up, because chairs want to know how their department compares to the one down the hall. Then deans ask for the college view, because they want to know how their college compares to the others. Then the provost's office starts asking, because at that point it's a number that describes the whole institution.
None of that requires a policy. A score is the first accessibility artifact that different roles can compare against each other. A file check is meaningless to a dean. A course-level score is not.
The reason it spreads, when a file report never did, comes down to arithmetic. You can average scores. You cannot average verdicts. Ten thousand "this PDF fails" results don't sum into anything a chair can act on, so they stay in the accessibility office as a backlog. A course at 68 and another at 91 average into a department at 79, and that 79 sits in a row next to every other department. That's all it takes. Nobody wants to be the bottom row, and higher education accessibility finally has a number that makes the bottom row visible.
At the provost's level, the score lands next to the number every provost already watches: retention. And accessibility connects to retention directly.
The connection isn't abstract. A student who opens week six and finds that the readings won't work with their screen reader, or that the scanned chapter is an image with no text underneath, is a student who falls behind that week and every week after. Accessibility compliance, framed as a legal posture, never made that case to a provost. Framed as retention, it makes itself.
Students who use the accommodations they were referred to retain at higher rates than students who were referred and never followed through. One accessibility team reported a 10 to 15 percent lift in early-term retention between the two groups. That's the kind of connection a provost's office can act on, and once the score is on the same dashboard as retention, nobody has to argue for it. At that point the accessibility score stops reading as a compliance line item and starts reading as a retention number, which is the only kind of number a provost's office reliably protects in a budget.
Now every level of the institution has a reason to look at the number. It needs one more thing to keep working, which is a way to be governed.
An average lies. A campus can sit at 97% overall while one course fails on every file. So the institutions that get the most out of their score set a floor per item, not per average: every single file in every course clears 90%. That floor gets reviewed monthly, in a standing committee where the provost has a seat, with the same report going to every dean and chair.
The 97% is the trap. It reads like near-done, and it hides the course where a blind student has nothing at all. An average rewards the easy wins and buries the students who are actually locked out, which is the opposite of what accessibility compliance is supposed to protect. A floor per item can't be gamed the same way. Either every file clears the bar or the course doesn't, and the one course failing on every file shows up instead of dissolving into a comforting campus number.
Measure. Review. Support. Improve. Monitor. That's a governed metric.
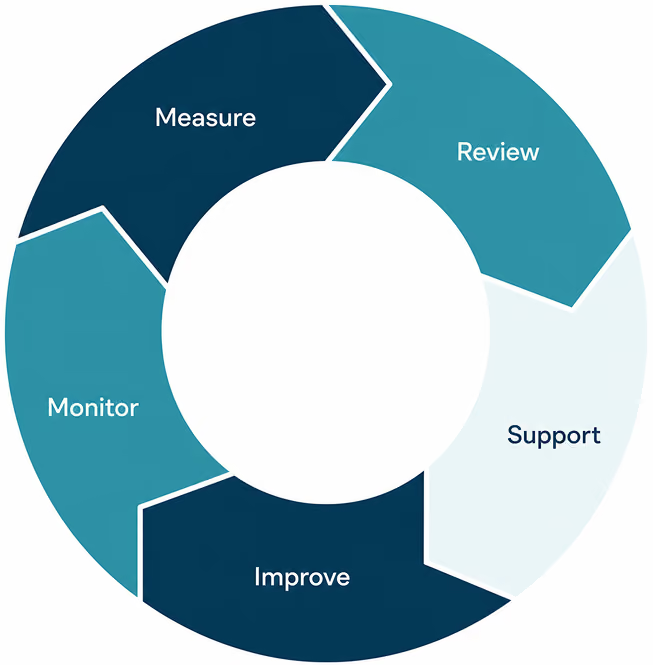
This is the difference between an accessibility assessment you run once for a report and an accessibility score you operate. A one-time assessment is true the day it's finished and stale the next term. A live score is the only version that survives contact with a real campus, where content never stops arriving.
The loop already fits your campus. What's missing is the number to start it. The CampusMind Score is that number, live from day one.
Every role you need already answers for a number. The chair for how their department compares, the provost for retention. The accessibility score is the first one they can all read the same way. That's what pulls the work out of the accessibility office and makes it something the whole institution acts on.